Further to our original review of the 2011 Census journey to work, the Office of National statistics (ONS) has identified that a subtle change in the wording of the question on working from home in the 2011 Census which made it difficult to compare the initial results of the 2001 and 2011 Census. The ONS have now released data which is comparable with the 2001 census and we have therefore updated our review of the figures. The changes have a significant impact on the reported level of working from home in 2011, which previously appeared to have reduced in general over the last 10 years.
The Office for National Statistics (ONS) has released the first tranche of travel data collected through the Census in March 2011. The data provides information on the main mode of travel to work by the area in which people live.
The table below summarises the results for the Bristol Local Authority Area, the South West Region and England as a whole. All proportions are calculated based on figures for those in work or education in each of the areas.
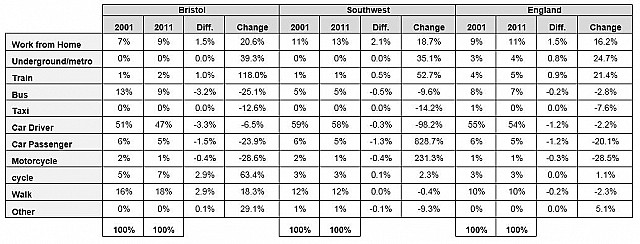
The data makes for very interesting reading as it appears to show that Bristol is bucking the national trend, by showing significant increases in sustainable travel and a bigger reduction in the number of car drivers, between the last census in 2001 and 2011.
Bristol has seen significant increases in the proportion of people cycling and walking, and the actual number of people using these modes. It is likely that some of the 63% increase in the level of cycling in the city is attributable to the Cycling City Project, which saw an investment of around £23 million in cycling infrastructure and related projects around the city area from 2008. The stated aim was to double the number of cyclists, which the figures presented by the ONS suggest may have been achieved. In 2001 the Census recorded 8,108 Bristol residents travelling to work by bike, in 2011 the figure has increased to 15,714, almost double the number of people.
Overall the results show that 25% of residents travel by walking and cycling compared to 15% across the South West and 13% across England..
The results also show a growth in train use both at national and local levels. In Bristol the increase was 118%, however this is calculated from a very low starting point.
Despite the positive aspect of the local Census results, there are also negative points. In Bristol there has been a 25% reduction in bus use over the past decade, a decline which will need to be reversed if the growth in sustainable travel in the city is to be maintained through the next decade. Across England there has been nearly no change in bus use over the past decade.
The results also show increases in the proportion of people working from home.
To give context to the results in Bristol it is interesting to compare them with other core cities across the country. The table below shows the comparable results for Newcastle upon Tyne, Leeds and Nottingham.
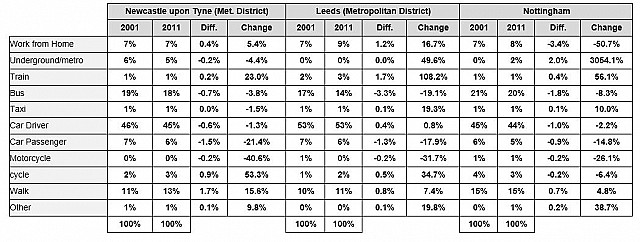
It can be seen that there are great variations in the changes in travel habits over the last 10 years. With the exception of Bristol, all areas in the West of England have seen increases in the number of car drivers, with North Somerset seeing a 1.6% increase. Cycling and walking have increased in all parts of the region, with Bath and North East Somerset and South Gloucestershire seeing double digit increases on 2001 figures. Across the region cycling has increased by 45% and walking has increased by 12%. With 5% of people in work cycling and 13% of people in work walking, the regional level of non-motorised sustainable travel is higher than seen in the core cities of Leeds and Newcastle-upon-Tyne and equal to Nottingham. Bus use is significantly down across the West of England with an overall reduction of 24.5%, North Somerset seeing the greatest reduction with a 39.8% drop in travel to work by bus.
In summary, we think the results show that, despite relatively high car ownership, hilly local terrain and typical British weather, there are opportunities to increase the level of sustainable travel with the correct investment and promotion.
The release of the data on the 30th January 2013, represents only a small fraction of the travel information which will be available when the full data set is published, hopefully by the end of 2013.
Although there are a number of other data sources which can be used to help understand travel characteristics, including the annual national travel survey, none of them are as comprehensive, or provide such localised data as the Census. The data is generally intended to be used as the basis for developing new government policies in all areas of life. Statistical analysis often leads to a range of different conclusions. Our perspective is that, with respect to transport in Bristol, the results highlight the value of investment in cycling and walking infrastructure and the need for further investment in public transport provision, in order to stem the apparent decline and raise the proportions for travel to work to those seen in contemporary core cities. Finally there must be scope to reduce travel by stemming the decline in home working.
One final thing worth considering when reviewing the figures, is that the 2011 Census was undertaken at the tail end of one of the worst recessions seen in this country and around the world. This may well skew the results of the Census, possibly suppressing the use of paid-for modes of travel, such as cars and buses, while encouraging the use of ostensibly free modes such as cycling and walking….. but we will leave that to the statisticians and economists to figure out.
Matthew McFeat
Key Transport Consultants Ltd
0117 9209430