In the second of my series of three blogs (click here for the first) I compare Bristol to contemporary cities in the UK and abroad.
Is it fair to complain about transport and travel in Bristol?
Expanding my contemplations, I wondered how Bristol is faring against other cities, in the United Kingdom and abroad, and for the first of these the 2011 Census results are a mine of useful information.
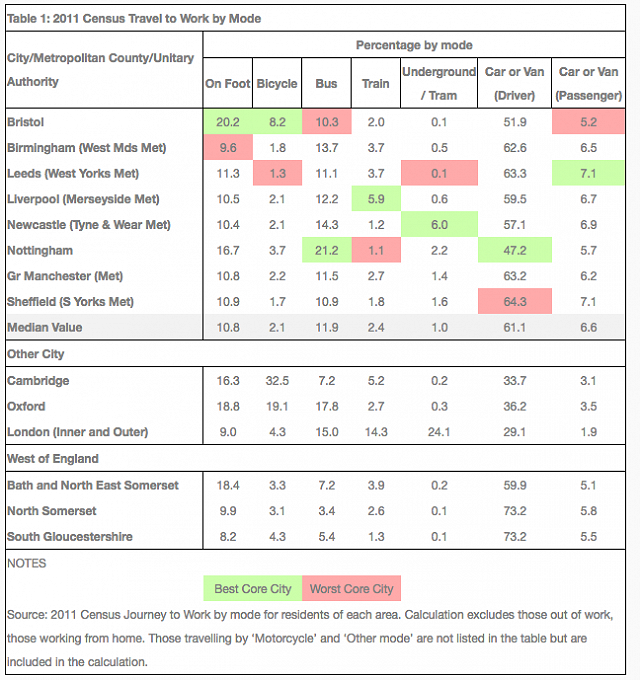
To start with I looked for information on how people living in England’s eight largest cities outside London – the so called Core Cities – travelled to work and I’ve reproduced their positions in the table below. For those with Metropolitan Counties running their transport systems (all except Bristol and Nottingham) I’ve given the figures for that area. (I realise that opens the analysis to immediate cries of foul but you have to start somewhere.) I’ve also included a few other cities and the neighbouring West of England Unitary Authorities, and have highlighted the best and the worst Core City in each category, and provided the median value for those cities.
So what do we learn from this information?

Well Bristol is clearly head and shoulders above the rest of the other Core Cities for walking and cycling to work. It also beats flat-as-a-pancake cities like Oxford and Cambridge for walking. We are still well behind Cambridge for cycling, a city which is renowned for its high cycle usage. And even the neighbouring West of England unitary authorities fair well in comparison with the Core City median values for walking and cycling, in spite of the relative disadvantage caused by their large rural areas.
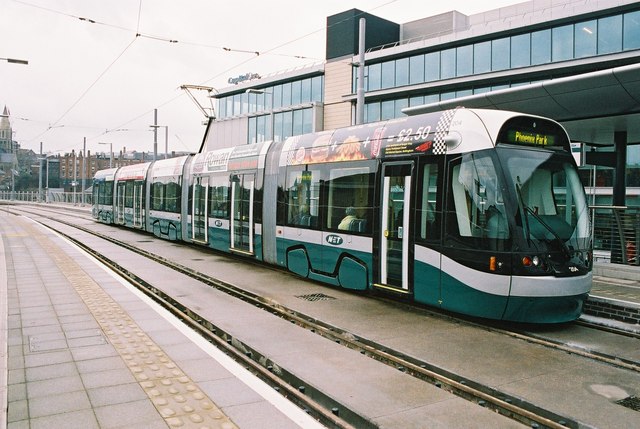
On bus use five of the eight Core Cities have percentages between 10 and 15%. At 10.3%, Bristol is at the bottom of the range but it’s not far from the median of 11.9%, so there’s work to do but equally, nothing to get too excited about. However, the surprise here is the 21.2% achieved in Nottingham, a big margin above the rest and even higher than London, which begs the question, “what’s different in Nottingham?” I don’t know the answer but one fundamental difference between Bristol and Nottingham’s bus operations is that Bristol’s buses are privately operated whereas Nottingham’s buses are run by Nottingham City Transport, which is 95% owned by Nottingham City Council. So it looks like Bristol and the other Core Cities, even those with Metropolitan Counties, would do well to learn from Nottingham.
Variation amongst the Core City train statistics is not that great and Bristol is only just below the median, which strikes me as being very good, given the paucity of the suburban network left by Dr Beeching. The figures that caught my eye here were those for Liverpool and Manchester, where Beeching left reasonable suburban networks, but I believe Liverpool is the only city outside London able to award rail franchises. Is that the reason why Liverpool attracted more than twice the population of commuter rail passengers than Manchester in 2011?
Given that Bristol has neither an underground nor a tram, you might ask why I included this category but, as most of the Core Cities do, I thought it worth a look. It came as a big surprise to me that in the cities with these systems available, the proportions travelling to work by this mode are really very small. Newcastle, with its Metro light rail system, tops the league with just 6.0% and Nottingham is next best at 2.2%.
Combining the train and tram figures it does not surprise me that Bristol comes bottom, with just 2.2%, and Newcastle is top at 7.2%, with Liverpool not far behind on 6.4%. The same exercise for combined bus, train and tram puts Nottingham top at 24.6%, Newcastle on its heels at 21.4% and Bristol bottom with a lowly 12.5%, compared to a median of 16.8%.
That leaves just car travel and here it’s Nottingham that catches the eye again, its proportion of 47.2% car and van drivers being approximately 27% (17.1 percentage points) below the median of 61.1%. I wondered whether this was influenced by Nottingham’s introduction of a Workplace Parking Levy but, as that started in the year after the last Census, that doesn’t seem likely to be the explanation. So what’s behind Nottingham’s apparent success? Working there last year my impression was that the roads seemed to be pretty badly congested in peak periods, so perhaps that’s an influence on people’s choice of travel mode. However, my two day visit provided only a snapshot and no basis to make a judgement. So I looked at the Census data for the neighbouring local authorities and found that they all have car driver percentages over 66%. I then discovered that the Nottingham Unitary Authority, whose data I was using, has a very tightly drawn boundary that comprises only urban area and doesn’t include large parts of the city’s suburbs. So I suspect these two factors provide part of the answer. Although drawn from a reputable source, as is so often the case, the statistics don’t tell the whole story, and it looks like Nottingham’s car commuting is perhaps not really as good as my simple assessment suggested. This might also account for Bristol, the only other non-Metropolitan County amongst the Core Cities in my table, doing rather well in this category. At 51.9%, it’s below the median of 61.1% but balanced by the figures for North Somerset and South Gloucestershire which both have 73.2%, things don’t look quite so good.
So overall, how does Bristol compare against its English contemporaries? On walking and cycling it leads the way and deserves 10 out of 10. On public transport I’d give the West of England together 4 out of 10 and “could do better”, although that doesn’t imply criticism. The city and its travel to work area are hamstrung by the aftermath of Beeching on the rail network and by the lack of centralised control over bus services. So I think the figures provide convincing grounds to continue the West of England’s efforts to improve the public transport system serving Bristol. As a consequence, I’ll support any campaign to achieve greater local control over both bus and rail. On car use – and notwithstanding a horrendous journey I had across the city recently – I don’t think the city is doing too badly, with car driver percentages comparing well against most contemporaries. I also note that, just like all the other Core Cities it is by far and away the most popular mode chosen for travel to work. So, like it or not, the car is here to stay for the time being and we’d better keep that in mind when planning the future of our cities.
Having looked at some other English cities, and with Bristol having taken over from Copenhagen as European Green Capital, it seems appropriate to comment briefly on that city’s transport systems.

Over the course of a long weekend’s study visit to Copenhagen in 2013 we at Key Transport learnt much about the city’s transport systems, their history and the culture, all of which contribute to making the place what it is today. I will only summarise here but if you wish to see a fuller account of our experiences please read our Copenhagen study tour blog.
In short, from the 50s onwards, as in most of Europe, Denmark was in love with the car and cycle use had fallen to 10% of all trips. Then the fuel crisis of the 70s hit and the Danish government imposed car free Sundays as a fuel saving measure. This reminded many Danes of the pleasures of cycling and sparked a growth in cycling lobby groups who demanded better cycle infrastructure, and in particular, segregation from car traffic. In the 80s, with a declining industrial centre and loss of city centre population, the Mayor of Copenhagen – a former head of the Municipality Traffic Department – instigated strategies to increase cycling and improve the city’s public transport. So the city we see today is the product of 30+ years of policies and investment in sustainable transport. Among other things this has delivered two new underground lines with a third and fourth under construction, a suburban rail and underground network with over 200 stations – compare that to the 25 on Bristol’s travel to work rail network – an equally impressive bus network and a network of segregated cycle lanes that even the most nervous cyclist finds easy to use. Unsurprisingly, car ownership in Copenhagen is low because many residents simply don’t need a car but that must surely also be influenced by the high levels of tax on cars, which can be as much as 180%.
Overall, therefore, there is much for Bristol and other British cities to learn from Copenhagen. First, the city is what it is today because they’ve been working on their transport systems for a long time. So we have a lot of catching up to do, especially with our suburban rail network, which probably needs a similar 25 to 30 year programme of improvements and enhancement. In due course I would love to be able to emulate our host for one meeting who explained that he lived in a rural village a few miles from Copenhagen and his daily commute comprised a five minute bike ride to his local station, fifteen minutes on the train, and finally five minutes to the office on a second bike that he keeps at the city centre station. If I could do the same from Wrington, even I might abandon my car…… but I suspect I may have retired before that option is available.

In comparing and contrasting cycling in Bristol and Copenhagen, we have to keep in mind that the latter is flat, very flat. So I don’t think we’ll ever see as many cyclists in Bristol. But I do think we need to continue improving the cycle infrastructure and by doing so, we should see a continuing growth in cycling. For me, cycling up Park Street will still be something of a challenge but maybe that could be solved with a Trondheim style bike lift.
Finally, though, when it comes to walking I’m pleased to say that there are some lessons Bristol can teach Copenhagen because I believe its right to prioritise the needs of pedestrians over cyclists, whereas Copenhagen has done the opposite. In terms of pedestrian infrastructure we saw many poor examples, such as a footway squeezed outside a row of shops to less than 1.0m to make way for the adjacent 2.0m cycleway, and barely a drop kerb or tactile paving to aid the disabled and people with pushchairs, and the blind and partial sighted at road crossings.